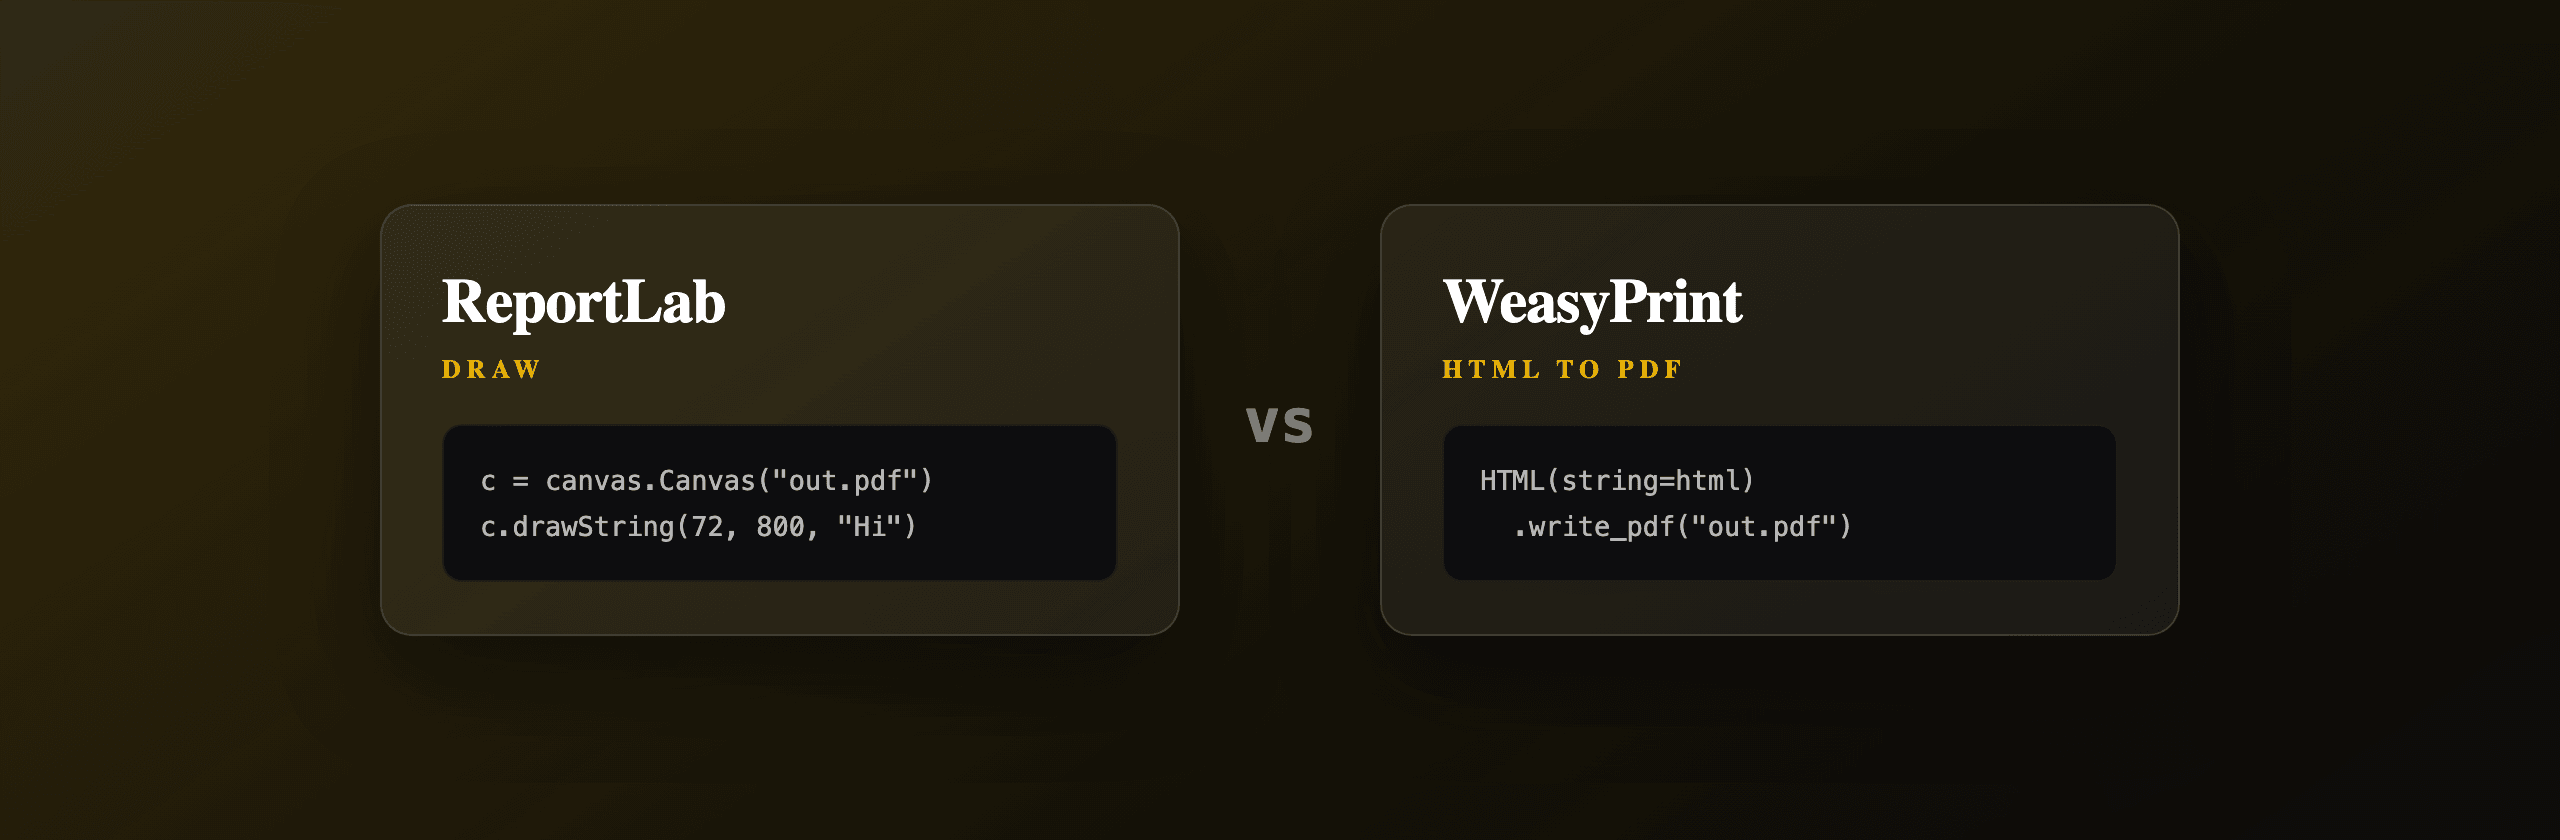
ReportLab and WeasyPrint solve Python PDF generation with two different mental models: ReportLab draws a PDF imperatively with code (canvas operations and Platypus flowables), while WeasyPrint renders HTML and CSS to PDF like a tiny print browser. Choose ReportLab when you need exact coordinate control, charts, or barcodes. Choose WeasyPrint when you already write HTML and want designed documents fast. This guide compares API style, CSS support, fonts, charts, system dependencies, and the scenarios where each wins.
ReportLab vs WeasyPrint at a glance
The fastest way to decide: if your document lives as HTML and CSS, reach for WeasyPrint. If you build the layout in code with pixel-level positioning, reach for ReportLab. The table below maps the practical differences that drive most decisions.
| Factor | ReportLab | WeasyPrint |
|---|---|---|
| Mental model | Draw with code (canvas + flowables) | Render HTML and CSS |
| Input format | Python objects, no HTML | HTML + CSS (often via Jinja2) |
| CSS support | None (you style in code) | CSS 2.1 + good paged media |
| JavaScript | No | No |
| Fonts | TTF/OTF via registerFont | @font-face, system fonts via Pango |
| Charts/graphics | Built-in reportlab.graphics | Via SVG or pre-rendered images |
| Barcodes | Built-in (reportlab.graphics.barcode) | Via image or font |
| System deps | None (pure Python) | Pango, cairo, GDK-PixBuf |
| Learning curve | Steep for layout | Gentle if you know CSS |
| License | BSD (open source) | BSD-3-Clause |
| Best for | Precise programmatic reports | Designed, content-driven documents |
Both libraries are free and BSD-licensed. Neither runs JavaScript. The split is about how you describe the page, not about cost or licensing.
When should you use ReportLab?
Use ReportLab when you need total control over where every element sits on the page, or when the document needs charts, barcodes, or precise tabular layouts generated entirely from data. ReportLab is the de-facto choice for financial statements, scientific reports, shipping labels, and any output where a designer hands you exact coordinates rather than HTML.
ReportLab gives you two layers. The low-level canvas API draws text, lines, and shapes at absolute coordinates (the origin is the bottom-left corner, in points, where 72 points equal one inch). The high-level Platypus layer ("Page Layout and Typography Using Scripts") flows content with Paragraph, Table, Image, and Spacer objects that wrap across pages automatically.
Install it with no system libraries:
pip install reportlabHere is a Platypus document with a styled table, the pattern most production reports use:
from reportlab.lib import colors
from reportlab.lib.pagesizes import A4
from reportlab.lib.styles import getSampleStyleSheet
from reportlab.lib.units import mm
from reportlab.platypus import (
    SimpleDocTemplate, Table, TableStyle, Paragraph, Spacer
)

styles = getSampleStyleSheet()
doc = SimpleDocTemplate(
    "invoice.pdf",
    pagesize=A4,
    topMargin=20 * mm,
    bottomMargin=20 * mm,
)

rows = [
    ["Item", "Qty", "Unit", "Total"],
    ["Design audit", "1", "1200.00", "1200.00"],
    ["Implementation", "8", "150.00", "1200.00"],
    ["Support plan", "1", "400.00", "400.00"],
]

table = Table(rows, colWidths=[80 * mm, 25 * mm, 30 * mm, 30 * mm])
table.setStyle(TableStyle([
    ("BACKGROUND", (0, 0), (-1, 0), colors.HexColor("#111827")),
    ("TEXTCOLOR", (0, 0), (-1, 0), colors.white),
    ("FONTNAME", (0, 0), (-1, 0), "Helvetica-Bold"),
    ("ALIGN", (1, 0), (-1, -1), "RIGHT"),
    ("GRID", (0, 0), (-1, -1), 0.5, colors.HexColor("#e5e7eb")),
    ("ROWBACKGROUNDS", (0, 1), (-1, -1), [colors.white, colors.HexColor("#f9fafb")]),
]))

story = [
    Paragraph("Invoice INV-001", styles["Title"]),
    Spacer(1, 8 * mm),
    table,
]
doc.build(story)
ReportLab also ships reportlab.graphics.barcode for Code128, QR, and EAN barcodes, and a charting module for bar, line, and pie charts drawn as vectors. That makes it strong for labels and dashboards where the data drives the visual.
The honest caveat: building a designed multi-section document in Platypus means thinking in flowables and frames, not in CSS. Aligning columns, controlling page breaks, and styling repeated headers takes more code than the equivalent HTML. If a designer hands you a Figma mockup, translating it into ReportLab calls is slow.
When should you use WeasyPrint?
Use WeasyPrint when your document is content-driven and styled with CSS, especially when you already render HTML with a template engine like Jinja2. WeasyPrint reads HTML and CSS and produces a PDF that matches the print box model, which makes invoices, certificates, contracts, and reports much faster to build and to restyle.
WeasyPrint implements a large slice of CSS 2.1 plus CSS paged media: @page rules, margin boxes for running headers and footers, page-break control, and CSS counters for page numbers. Its official documentation tracks supported features in detail.
Install requires the library plus system graphics libraries (Pango for text shaping, cairo and GDK-PixBuf for rendering):
# System libraries WeasyPrint needs at runtime
sudo apt-get install libpango-1.0-0 libpangocairo-1.0-0 libgdk-pixbuf2.0-0

pip install weasyprint
The render call itself is one line. Here it is paired with Jinja2 so the same template works for any data:
from jinja2 import Template
from weasyprint import HTML

template = Template("""
<!doctype html>
<html>
  <head>
    <style>
      @page { size: A4; margin: 20mm; }
      @page { @bottom-center { content: "Page " counter(page); } }
      body { font-family: "Inter", sans-serif; color: #111827; }
      h1 { font-size: 22px; }
      table { width: 100%; border-collapse: collapse; }
      th { background: #111827; color: #fff; text-align: left; padding: 8px; }
      td { border-bottom: 1px solid #e5e7eb; padding: 8px; }
      thead { display: table-header-group; } /* repeats on every page */
    </style>
  </head>
  <body>
    <h1>Invoice {{ number }}</h1>
    <table>
      <thead><tr><th>Item</th><th>Qty</th><th>Total</th></tr></thead>
      <tbody>
        {% for line in lines %}
        <tr><td>{{ line.name }}</td><td>{{ line.qty }}</td><td>{{ line.total }}</td></tr>
        {% endfor %}
      </tbody>
    </table>
  </body>
</html>
""")

html = template.render(
    number="INV-001",
    lines=[
        {"name": "Design audit", "qty": 1, "total": "1200.00"},
        {"name": "Implementation", "qty": 8, "total": "1200.00"},
    ],
)

HTML(string=html).write_pdf("invoice.pdf")
For fonts, WeasyPrint resolves @font-face from a URL or local file, and falls back to system fonts through Pango. That means web font workflows carry over with almost no changes.
The honest caveats: WeasyPrint never runs JavaScript, so charts drawn by Chart.js or any client-side script will not appear (pre-render them to SVG or PNG instead). Its CSS coverage is broad but not identical to a browser, so some flexbox and grid edge cases or advanced selectors render differently. And the Pango/cairo system dependency makes Docker images and AWS Lambda layers heavier than a pure-Python install.
How do they compare on fonts, charts, and page features?
ReportLab styles in code while WeasyPrint styles in CSS, and that difference shows up most clearly in fonts, charts, and paged-media features. The table below shows how each handles the parts of a real report that usually cause friction.
| Capability | ReportLab | WeasyPrint |
|---|---|---|
| Custom fonts | pdfmetrics.registerFont(TTFont(...)) | @font-face or system fonts |
| Repeated table headers | LongTable with repeatRows | thead { display: table-header-group } |
| Page numbers | canvas.drawString in onPage callback | counter(page) in @page margin box |
| Charts | Native vector charts and barcodes | SVG or pre-rendered images |
| Multi-column text | Manual frames | CSS columns |
| Right-to-left text | Limited, manual | Via Pango shaping |
| Exact positioning | Native (coordinate based) | Through CSS layout only |
For repeated headers in ReportLab, the snippet is a single argument:
from reportlab.platypus import LongTable

table = LongTable(rows, repeatRows=1)  # header row repeats on each page
For the same effect in WeasyPrint, the browser-style CSS rule does it:
thead { display: table-header-group; }The takeaway: anything visual and data-driven (barcodes, native charts, precise stamps) is easier in ReportLab. Anything that reads like a styled document (typography, columns, paged margins) is easier in WeasyPrint.
What if you need JavaScript or browser-exact CSS?
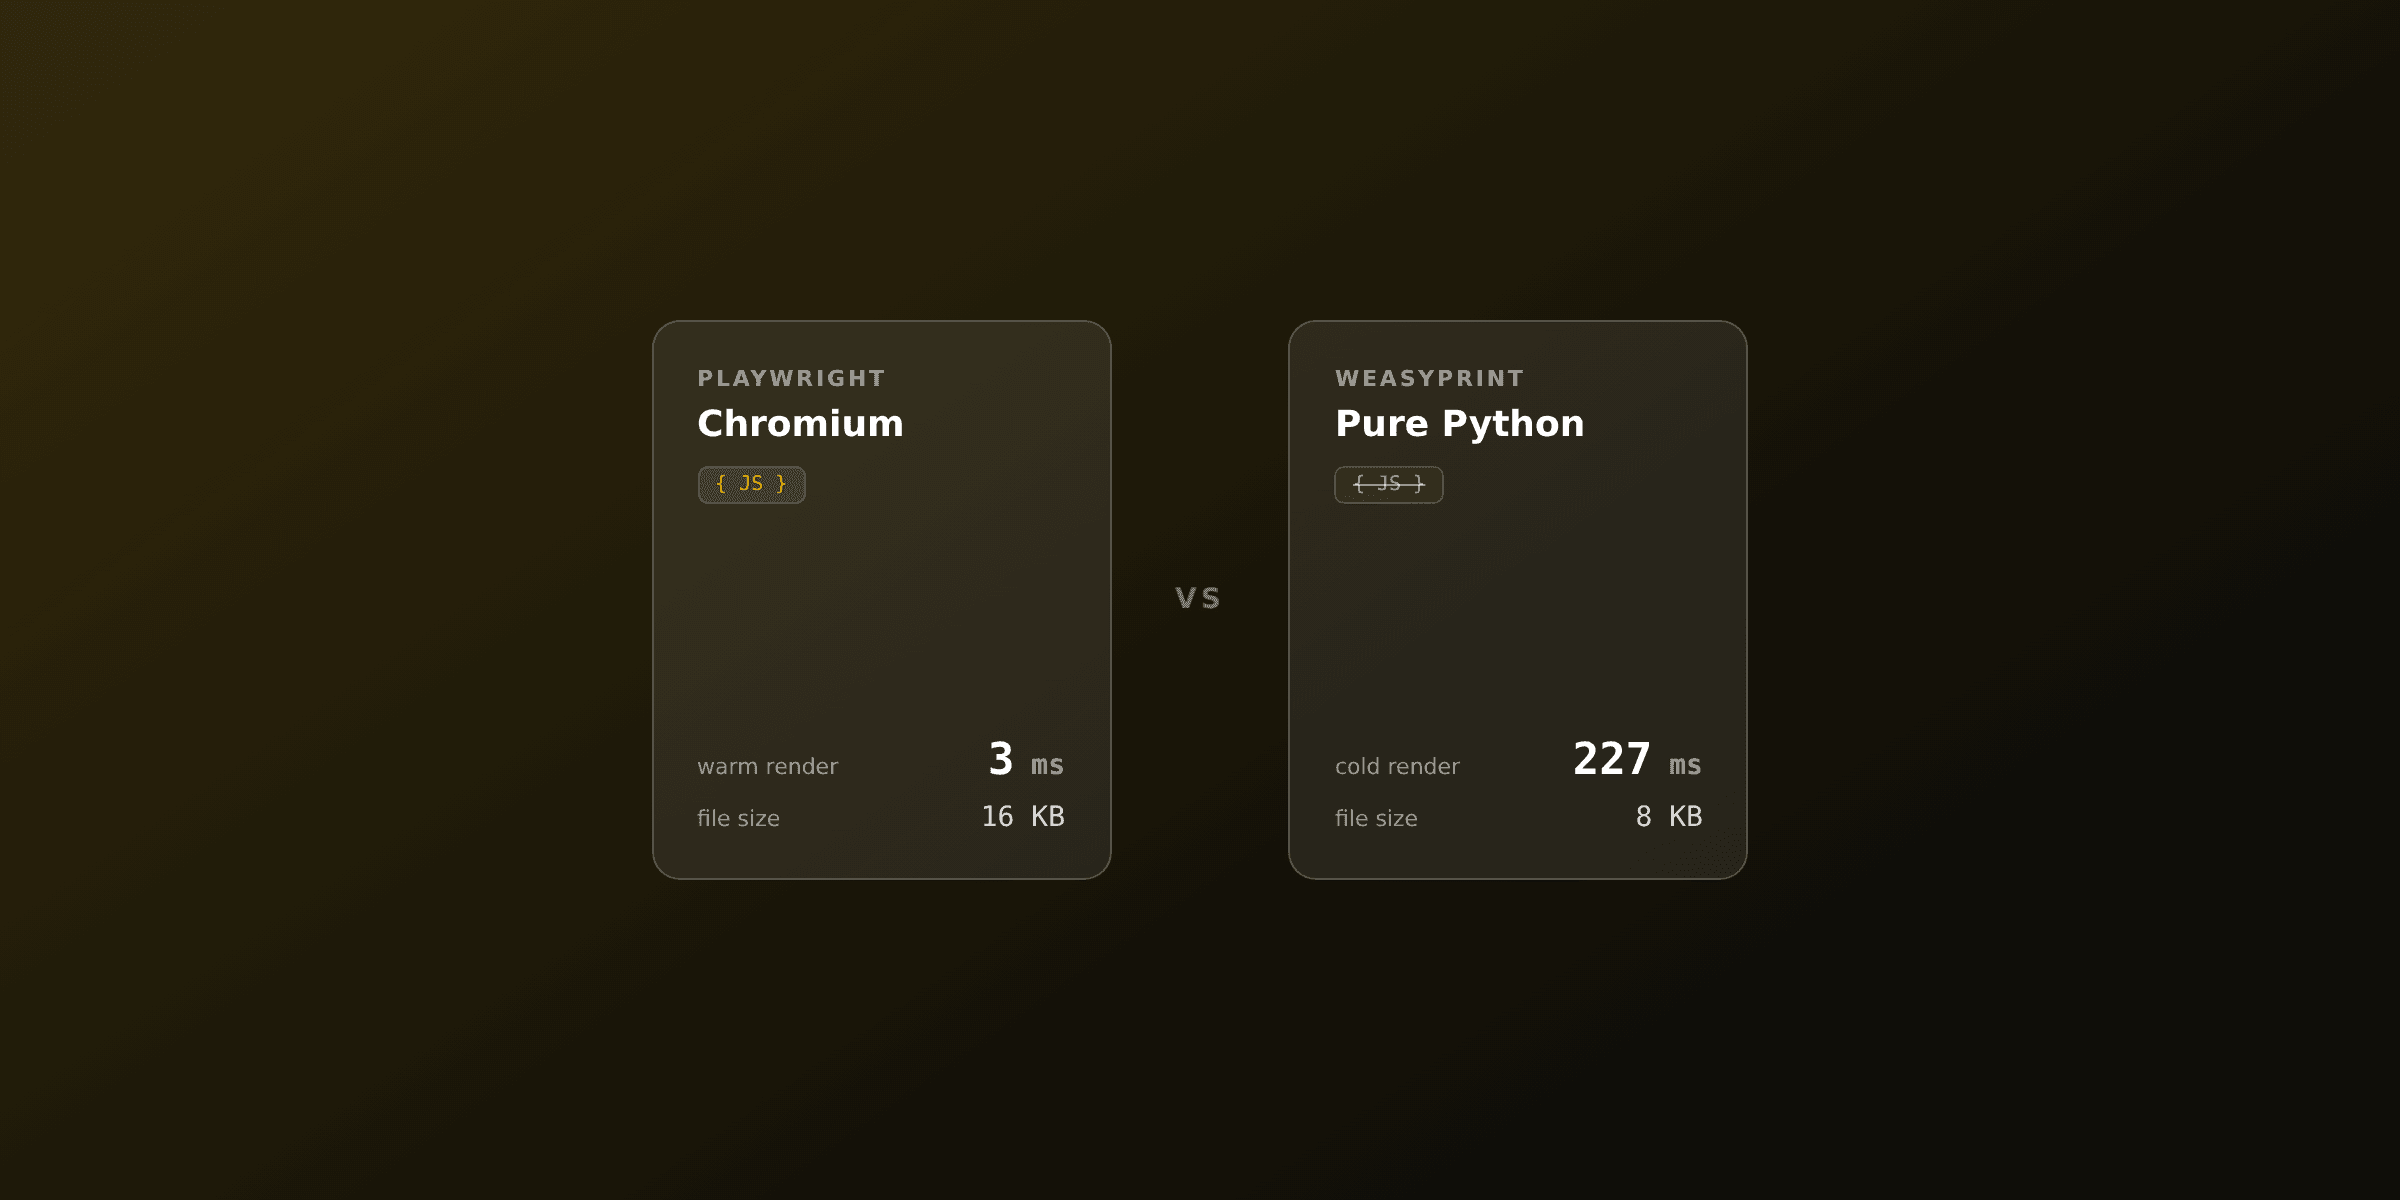
Neither ReportLab nor WeasyPrint runs JavaScript or matches a real browser pixel-for-pixel, so if your document depends on JS-rendered charts, flexbox-heavy layouts, or web components, you need a headless Chromium renderer instead. That means either running Playwright or Puppeteer yourself, or calling a hosted API that runs Chromium for you.
PDF4.dev is the hosted Chromium path: you POST HTML (with {{variables}}) and get a PDF back, with no Pango libraries to install, no headless browser to maintain, and no serverless cold-start to fight. It is the "no infrastructure" option when HTML and CSS fidelity matters, including the JavaScript and modern-CSS cases WeasyPrint cannot cover.
curl -X POST https://pdf4.dev/api/v1/render \
  -H "Authorization: Bearer p4_live_xxx" \
  -H "Content-Type: application/json" \
  -d '{
    "html": "<h1>Invoice {{number}}</h1><p>Total: {{total}}</p>",
    "data": { "number": "INV-001", "total": "$2,800.00" },
    "delivery": "url"
  }'
The trade is the same one every hosted service makes: you depend on an external API and a network call instead of a local function. If your documents are simple and offline, ReportLab or WeasyPrint in-process is the lighter choice. If they need a real browser engine, a hosted Chromium API removes the operational weight. You can also try the same render flow in the browser with Html To PdfTry it free before writing any code.
Which option should you choose?
Pick by where your layout lives and what the document needs to render. The recommendations below map common scenarios to a clear default.
- You build layout in code with exact coordinates, charts, or barcodes: ReportLab. The Platypus and canvas APIs give precise control and native vector graphics with zero system dependencies.
- You already have HTML and CSS, often from Jinja2 templates: WeasyPrint. One
write_pdf()call turns your markup into a paged document, and restyling is just CSS. - You render financial or scientific reports driven entirely by data: ReportLab, because tabular precision and programmatic charts are its strength.
- You design content-heavy documents (invoices, certificates, contracts): WeasyPrint, because CSS paged media and
@font-facemake designed output fast. - Your document needs JavaScript, JS-drawn charts, or browser-exact flexbox/grid: a headless Chromium renderer (Playwright self-hosted) or the hosted PDF4.dev API.
- You want zero PDF infrastructure to install or maintain: PDF4.dev, which runs Chromium server-side so there are no Pango libraries or browser binaries in your image.
A practical hybrid: keep WeasyPrint for the 90% of documents that are static HTML and CSS, and reach for a Chromium-based renderer only for the few that need JavaScript. You get the fast developer loop for the common case and full browser fidelity for the exceptions.
ReportLab and WeasyPrint are not really competitors. They sit at opposite ends of one spectrum: code-drawn precision versus markup-driven design. Match the tool to how your document is described, and add a Chromium renderer only when you hit the JavaScript or modern-CSS ceiling that both Python libraries share.
Free tools mentioned:
Start generating PDFs
Build PDF templates with a visual editor. Render them via API from any language in ~300ms.