Charts render in a PDF only if the engine that produces the PDF can run JavaScript. Chart.js, D3, and ApexCharts draw at runtime in the browser, so a headless Chromium renderer (Playwright or Puppeteer) prints them correctly while WeasyPrint and wkhtmltopdf leave a blank box. The two reliable approaches are: run the chart in headless Chromium and print the rendered page, or pre-render the chart to a PNG or SVG and embed it as a static image. This guide shows both, with the code for each.
Why charts disappear in most PDF tools
A chart disappears in a PDF when the renderer does not execute the JavaScript that draws it. Chart.js attaches to a <canvas> element and paints pixels at runtime. If the PDF engine only parses static HTML and CSS, the canvas stays empty and the PDF shows nothing where the chart should be.
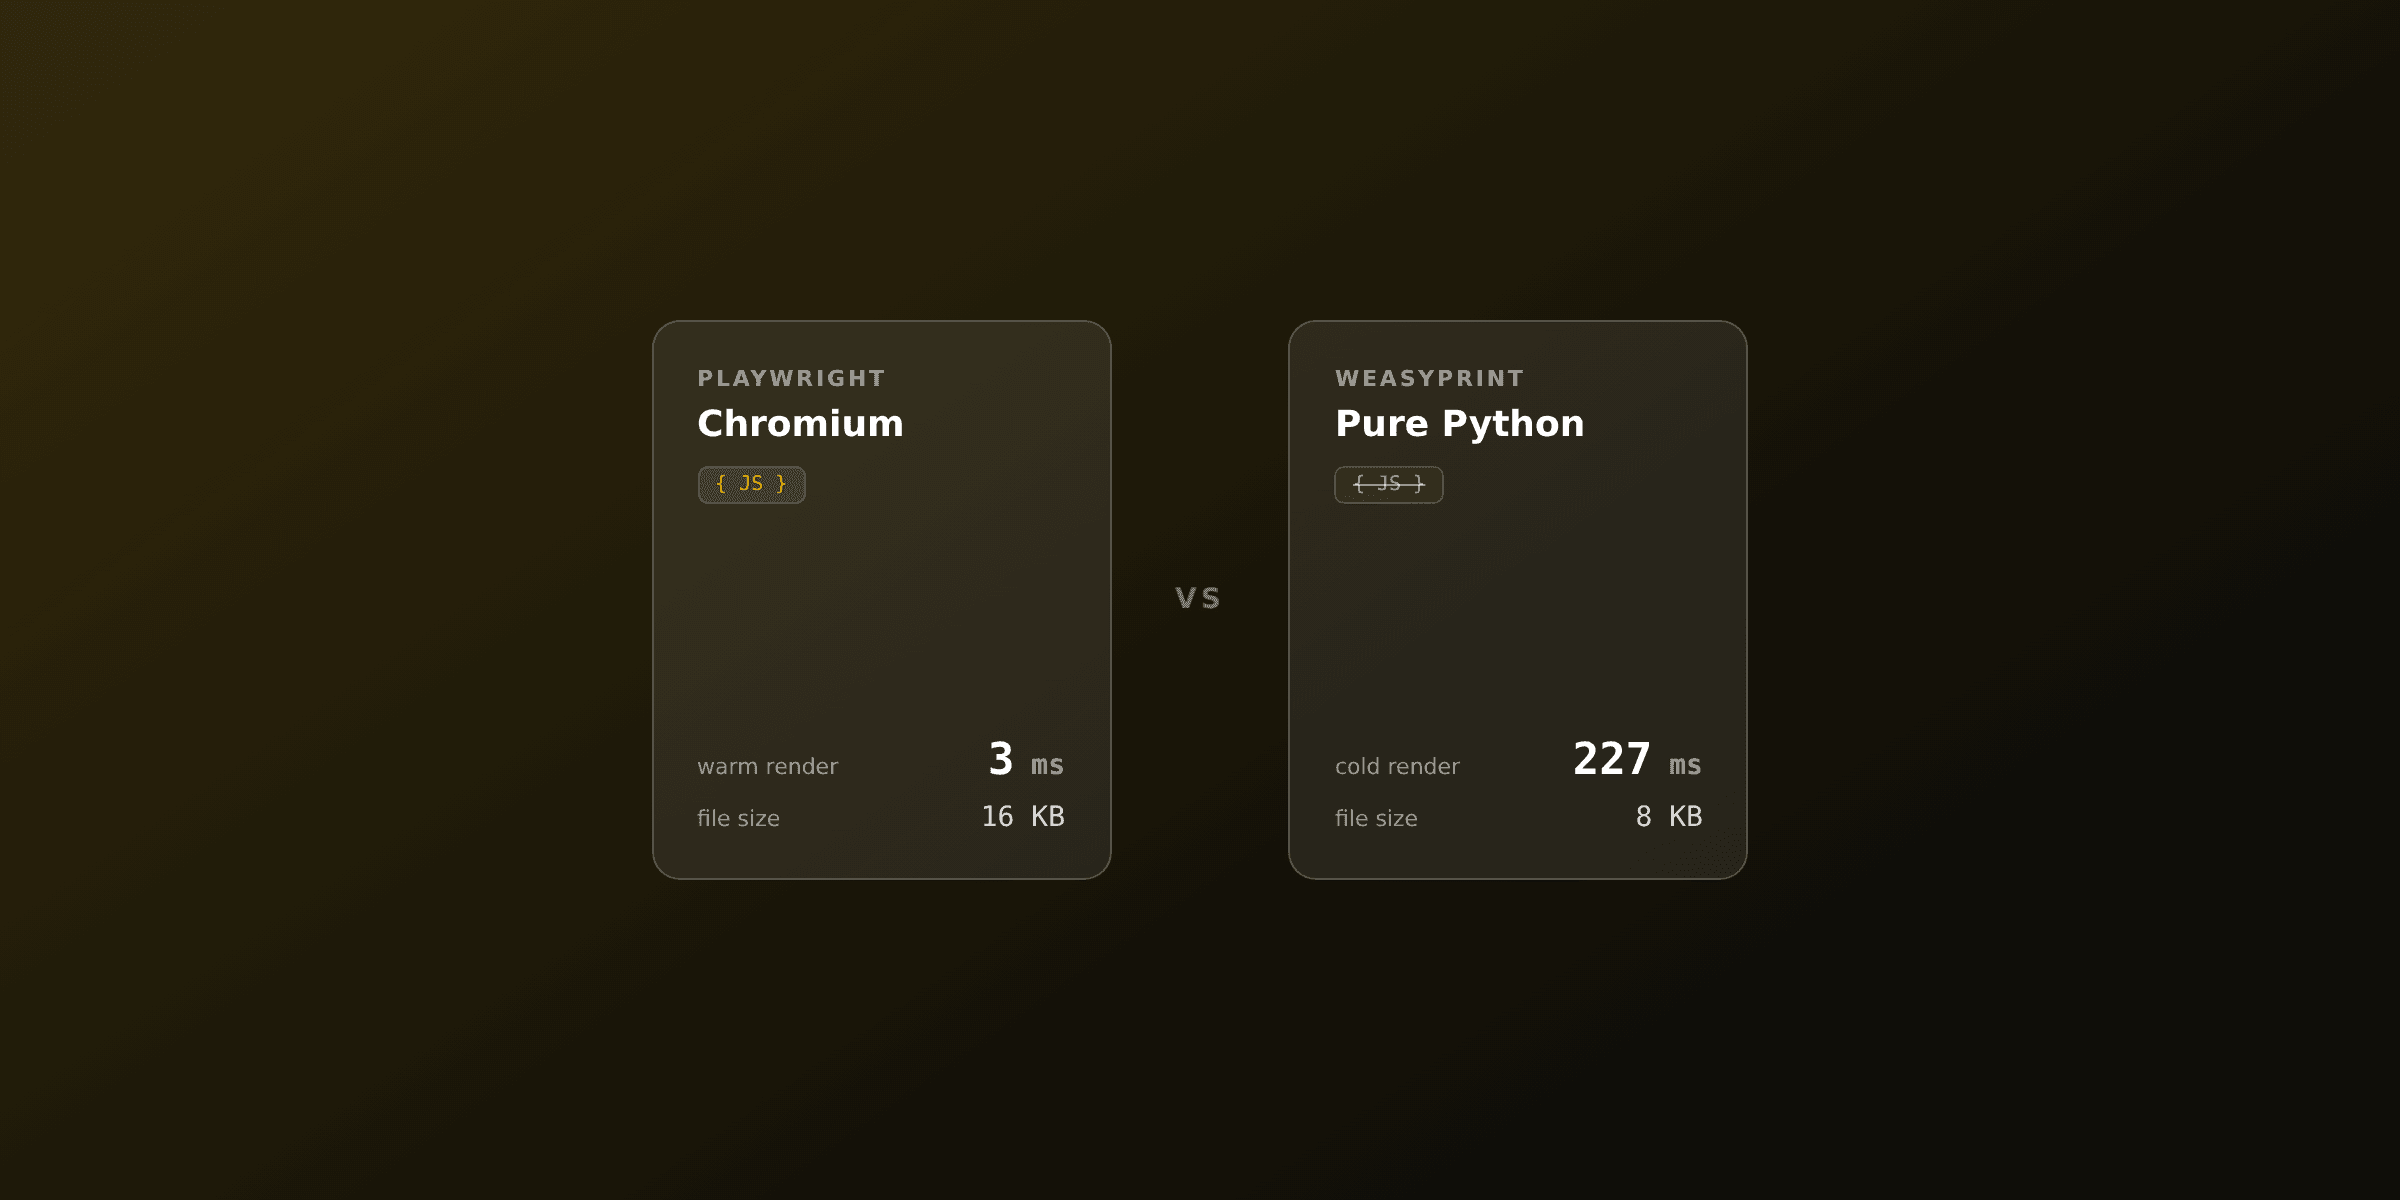
PDF engines split into two groups. JavaScript-capable engines (headless Chromium via Playwright or Puppeteer, and any service built on them) run the chart code before printing. Static engines (WeasyPrint, wkhtmltopdf, and PDF-construction libraries like pdf-lib or PDFKit) never run the script, so canvas-based charts come out blank.
This is the core decision for charts in PDFs: pick a renderer that runs JavaScript, or pre-render the chart to an image before the PDF step. There is no third option where a static engine magically draws a <canvas>.
Which approach should you use for charts in a PDF?
Use headless Chromium when you want the same chart code as your web app and live HTML layout around it. Use server-side image pre-rendering when you need speed at high volume or you are stuck with a static PDF engine. The table compares the practical trade-offs.
| Approach | Runs JS | Output quality | Speed | Best for |
|---|---|---|---|---|
| Headless Chromium + Chart.js (canvas) | Yes | Raster, sharp at 2x DPR | Medium (browser load) | HTML reports, dashboards exported to PDF |
| Headless Chromium + SVG charts (D3, ECharts SVG) | Yes | Vector, sharp at any zoom | Medium | Print-quality financial and scientific reports |
| chartjs-node-canvas (no browser) | Yes (Node only) | Raster PNG | Fast | High-volume batch reports |
| Chart image service (PNG URL) | Yes (remote) | Raster PNG | Fast, network dependent | Quick embeds, no infra |
| WeasyPrint / wkhtmltopdf + pre-rendered image | No (static) | Depends on source image | Fast | Existing static pipelines |
Speed labels are relative. A warm headless browser renders a one-chart page in roughly 300 to 600ms; chartjs-node-canvas typically renders a PNG in 50 to 150ms. Numbers vary with chart complexity and machine.
The rest of this guide covers the two approaches most teams reach for: headless Chromium for HTML-driven reports, and chartjs-node-canvas when a browser is too heavy.
How to render a Chart.js chart to PDF with headless Chromium
Put the chart in an HTML page, run it in headless Chromium, wait for it to finish drawing, then print. The one rule that breaks most first attempts: disable animation so the chart draws in a single synchronous pass before the print happens.
Here is a self-contained HTML template with a bar chart. Animation is off and devicePixelRatio is 2 so the canvas stays sharp in print.
<!doctype html>
<html>
  <head>
    <meta charset="utf-8" />
    <script src="https://cdn.jsdelivr.net/npm/chart.js@4"></script>
    <style>
      body { font-family: system-ui, sans-serif; margin: 40px; }
      .chart-box { width: 600px; height: 320px; }
    </style>
  </head>
  <body>
    <h1>Quarterly revenue</h1>
    <div class="chart-box"><canvas id="revenue"></canvas></div>
    <script>
      new Chart(document.getElementById("revenue"), {
        type: "bar",
        data: {
          labels: ["Q1", "Q2", "Q3", "Q4"],
          datasets: [{ label: "Revenue", data: [42, 58, 51, 73] }],
        },
        options: {
          animation: false,
          responsive: false,
          devicePixelRatio: 2,
        },
      });
    </script>
  </body>
</html>
Now render that HTML with Playwright. The script loads the page, waits for the network to settle so the CDN script is in, then writes the PDF.
import { chromium } from "playwright";
import { readFileSync } from "node:fs";

const html = readFileSync("chart.html", "utf-8");

const browser = await chromium.launch();
const page = await browser.newPage({ deviceScaleFactor: 2 });
await page.setContent(html, { waitUntil: "networkidle" });
await page.pdf({ path: "report.pdf", printBackground: true, format: "A4" });
await browser.close();
With animation: false, the chart is fully painted by the time setContent resolves with networkidle, so no extra wait is needed. If you keep animation on, the canvas may still be mid-draw when page.pdf() fires, producing a half-rendered or blank chart. For more on getting CSS layout right around the chart, see the CSS print styles guide.
How to wait for a chart that uses animation
If you cannot disable animation, wait for Chart.js to signal completion before printing. Register an onComplete callback that flips a flag on window, then have the renderer poll for that flag.
// inside the chart options
options: {
  animation: {
    onComplete: () => { window.__chartReady = true; },
  },
}
// in the Playwright script, before page.pdf()
await page.waitForFunction(() => window.__chartReady === true, { timeout: 5000 });This pattern matters when a chart depends on data fetched at runtime or when several charts animate in sequence. For most server-side reports, turning animation off is simpler and removes the timing risk altogether. Animation is a screen affordance; it adds nothing to a static PDF.
How to render charts without a browser using chartjs-node-canvas
When a full browser is too heavy, render the chart to a PNG in Node.js with chartjs-node-canvas, then embed that PNG in your HTML or place it with a PDF library. This skips Chromium, so it starts faster and uses less memory per render, which helps for batch jobs that produce hundreds of reports.
import { ChartJSNodeCanvas } from "chartjs-node-canvas";
import { writeFileSync } from "node:fs";

const canvas = new ChartJSNodeCanvas({ width: 600, height: 320 });
const image = await canvas.renderToBuffer({
  type: "line",
  data: {
    labels: ["Jan", "Feb", "Mar", "Apr"],
    datasets: [{ label: "Signups", data: [120, 190, 170, 240] }],
  },
  options: { devicePixelRatio: 2 },
});

writeFileSync("chart.png", image);
You then reference chart.png in an <img> tag inside the HTML you send to your PDF engine, or you draw it onto a page with pdf-lib. The trade-off: you lose live HTML and CSS flowing around the chart, and you maintain a separate rendering path from your web app. For a comparison of how the underlying engines differ, see Playwright vs WeasyPrint.
How to keep charts sharp instead of pixelated in a PDF
Raise the rendering resolution or switch to a vector renderer. A canvas chart is a raster image, so at 1x device pixel ratio it looks soft once the PDF is printed at 300 DPI or zoomed on screen. Two fixes work.
First, increase pixel density. Set devicePixelRatio: 2 or 3 in the Chart.js options and deviceScaleFactor: 2 on the browser page. This renders the canvas at double or triple the pixels, so lines and text stay crisp. The PDF file grows because the embedded image is larger.
Second, use an SVG-based chart for true vector output. D3, ECharts in SVG mode, and ApexCharts emit SVG, which scales to any size without blur and keeps text selectable in the PDF. SVG is the better choice for financial statements, scientific figures, and anything printed at large format. Chart.js itself is canvas-only, so vector output means a different library.
Adding charts with the PDF4.dev API
PDF4.dev renders HTML with headless Chromium, so Chart.js and any client-side chart library run the same way they do in your browser. You send the HTML, the chart script executes, and the chart prints in the PDF. There is no separate image pre-rendering step and no JavaScript-disabled fallback to work around.
curl -X POST https://pdf4.dev/api/v1/render \
  -H "Authorization: Bearer p4_live_xxx" \
  -H "Content-Type: application/json" \
  -d '{
    "html": "<html><head><script src=\"https://cdn.jsdelivr.net/npm/chart.js@4\"></script></head><body><canvas id=\"c\"></canvas><script>new Chart(document.getElementById(\"c\"),{type:\"bar\",data:{labels:[\"A\",\"B\",\"C\"],datasets:[{data:[5,9,7]}]},options:{animation:false,responsive:false}});</script></body></html>"
  }'
The same applies to reports built from a saved template with {{variables}} for the data, so you can push live numbers into a chart on every render. Try the HTML to PDF tool to test a chart page in the browser before wiring up the API. The decision is the usual one for any HTML-to-PDF workload: run and operate a headless browser yourself, or call an API that already does. The Chromium engine is the same either way. For production guidance on timeouts, retries, and caching, see PDF generation best practices.
Common mistakes when adding charts to PDFs
Most chart-in-PDF failures trace back to four mistakes. Each has a direct fix.
Printing before the chart draws. The page prints while the canvas is still animating. Fix: set animation: false, or wait for an onComplete flag.
Using a static engine for canvas charts. WeasyPrint or wkhtmltopdf cannot run Chart.js, so the chart is blank. Fix: switch to a Chromium renderer, or pre-render the chart to an image.
Soft or pixelated charts. The canvas rendered at 1x. Fix: raise devicePixelRatio to 2 or 3, or use an SVG chart library.
Responsive charts collapsing to zero height. Chart.js responsive mode needs a sized container; in a print context the container can compute to zero. Fix: set responsive: false and give the canvas an explicit width and height, as in the template above.
Frequently asked questions
The FAQ section above is also encoded as structured data for search engines. The short version: charts need a JavaScript-capable renderer, animation should be off for server-side prints, and SVG beats canvas when print sharpness matters.
Free tools mentioned:
Start generating PDFs
Build PDF templates with a visual editor. Render them via API from any language in ~300ms.